Imagine standing in a dark theater lobby, watching the digital board flicker with release dates. For decades, that board was dictated by gut feeling, relationships, and the sheer force of a marketing budget. But today, the real power behind those listings isn't just hype-it's hard data. Film metrics have transformed how distributors decide which movies land on which screens, turning what used to be an art into a precise science.
The shift toward data-driven booking is no longer optional for major studios or independent distributors. With rising production costs and fragmented audiences, guessing where a movie will perform is too risky. Instead, executives now rely on granular datasets to predict performance before a single ticket is sold. This approach ensures that every screen allocated to a film has the highest probability of generating revenue, reducing waste and maximizing returns.
Why Gut Feeling No Longer Works
In the past, a powerful distributor might secure prime weekend slots for a new release based solely on the reputation of the director or star. If it was a sequel to a hit franchise, it got the best seats. If it was an obscure indie, it fought for whatever remained. This method created significant inefficiencies. High-profile films often sat in underperforming theaters, while hidden gems struggled to find visibility in markets where they had no cultural traction.
Data changes this dynamic completely. By analyzing historical box office patterns, demographic shifts, and local economic indicators, distributors can match films to specific geographic markets with surgical precision. A horror film might thrive in college towns but flop in suburban family hubs. A documentary about agriculture might do better in rural areas than in dense urban centers. These nuances are invisible to the naked eye but obvious in the data.
The cost of misplacement is high. When a film is booked in a market with low affinity for its genre, occupancy rates drop. Low occupancy signals weak demand to other potential viewers, creating a negative feedback loop that kills the film's second and third weeks. Conversely, placing a niche film in a hyper-targeted market can create a cult following that sustains long-term revenue through re-releases and home video sales.
The Core Metrics That Drive Decisions
Not all data points are created equal. Distributors focus on a specific set of key performance indicators (KPIs) to build their booking models. These metrics provide the raw material for predictive algorithms and human analysis alike.
- Per-Screen Average (PSA): This is the most critical metric. It measures the average revenue generated per screen in a specific territory during a given week. A high PSA indicates strong audience demand relative to supply. If a film averages $15,000 per screen in New York but only $4,000 in Phoenix, the data suggests expanding in New York and contracting in Phoenix.
- Occupancy Rate: The percentage of available seats filled during showtimes. While PSA tells you the money, occupancy tells you the crowd. A film with high PSA but low occupancy might be selling expensive tickets to a small group. A film with moderate PSA but high occupancy suggests broad appeal that could justify more screenings.
- Demographic Alignment: Data from ticketing platforms reveals the age, gender, and income bracket of buyers. Matching these profiles to the target audience of the film ensures the marketing spend reaches the right people. For example, a teen-oriented comedy needs high school traffic, not corporate lunchtime crowds.
- Competitive Density: How many other films are competing for the same audience in the same region? If three big-budget action movies release in the same weekend, the fourth one is likely to suffer. Data helps identify "quiet" weekends or regions with less competition for specific genres.
- Social Sentiment Velocity: Modern tools track social media mentions, review scores, and viral trends in real-time. A spike in positive sentiment in a specific city can trigger an immediate increase in screens, capitalizing on momentum before it fades.
These metrics don't exist in isolation. They interact with each other to form a holistic picture of a film's health in a specific market. A distributor doesn't just look at one number; they look at the trend line across multiple variables.
Building the Predictive Model
Once the data is collected, the next step is building a predictive model. This isn't magic; it's statistical modeling applied to entertainment. The goal is to forecast the opening weekend performance and subsequent decay rate for a film in various markets.
- Data Aggregation: Combine internal box office reports with external data sources like census demographics, weather forecasts (which affect foot traffic), and local event calendars.
- Historical Benchmarking: Compare the current film's early indicators against similar past releases. If the current film has a 70% score on Rotten Tomatoes and a strong trailer view count, compare it to other films with similar stats from the last five years.
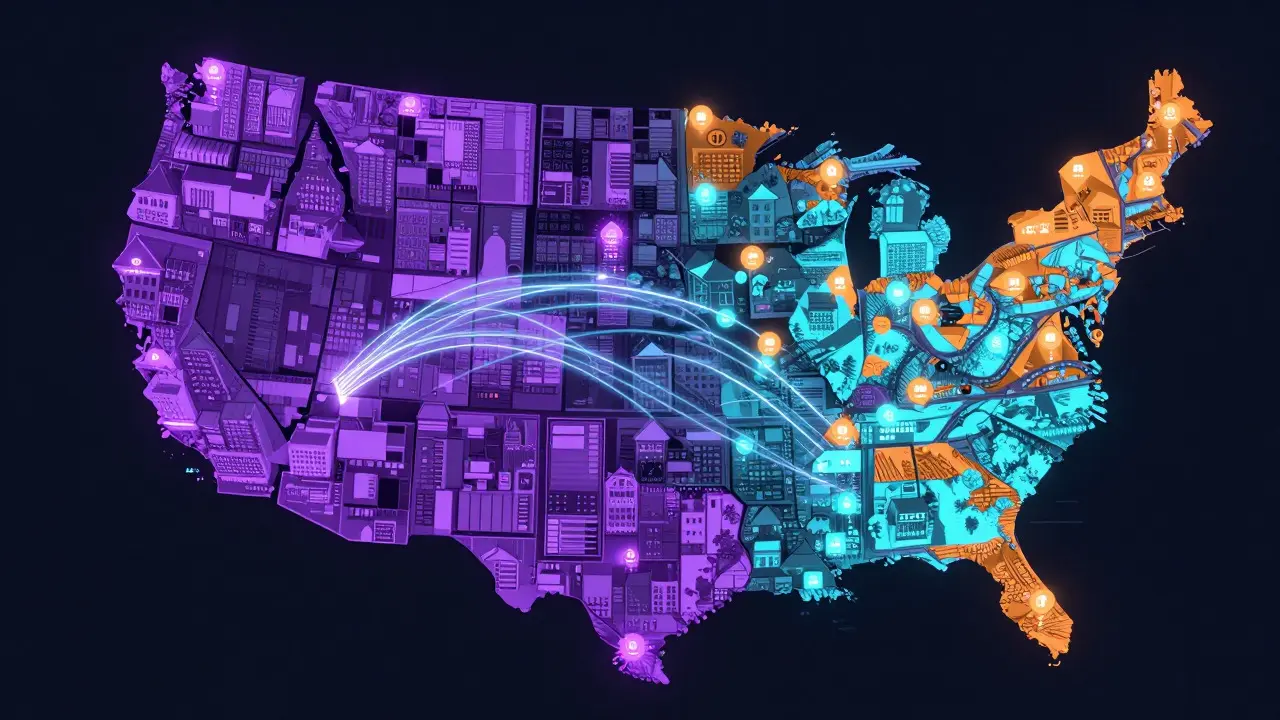
- Market Segmentation: Divide the country or region into micro-markets. Instead of treating "Texas" as one unit, break it down into Dallas, Houston, Austin, and rural counties. Each has different viewing habits.
- Scenario Planning: Run simulations. What happens if we add 20% more screens in Chicago? What if we pull back in Miami? The model predicts the net revenue impact of these changes.
- Decision Execution: Based on the simulation results, finalize the booking plan. This involves negotiating with theater chains to lock in specific screen counts and showtimes.
This process allows for agility. In the old days, once the poster was printed and the schedule set, changes were difficult. Now, if a film starts performing better than expected in its first two days, distributors can call theater managers on Wednesday to add Friday and Saturday matinees. This responsiveness is a direct result of data-driven decision-making.
Case Study: The Indie Breakout
Consider a hypothetical mid-budget thriller released in late autumn. Traditional wisdom would suggest a wide release across 2,000 screens to maximize initial buzz. However, the data tells a different story. Pre-sales in key cities are slow, but social sentiment in university towns is exploding. Reviewers are praising the script, but the cast is unknown.
A data-driven approach would avoid the wide release. Instead, it would book the film in 300 screens, heavily weighted toward college towns and urban centers with high student populations. The marketing budget would be shifted from national TV spots to targeted digital ads and campus events. As word-of-mouth spreads, the PSA in these targeted markets would climb rapidly. Once the PSA stabilizes above a certain threshold, the distributor would expand to neighboring suburbs, then to broader urban areas. This phased rollout minimizes risk and maximizes the lifetime earnings of the film, potentially doubling the return compared to a traditional wide release that burns out after one weekend.

Challenges and Pitfalls
While data is powerful, it is not infallible. Relying too heavily on numbers can lead to blind spots. Here are some common pitfalls distributors must avoid:
- Overfitting to Past Data: Just because a film performed well in a specific market five years ago doesn't mean it will do so now. Cultural tastes change. Algorithms must be regularly updated to reflect current trends, not just historical averages.
- Ignoring the Human Element: Data doesn't capture the "vibe" of a city or the influence of a local celebrity. Sometimes, a film succeeds because of a grassroots campaign that isn't reflected in pre-sales data. Human intuition should complement, not replace, data.
- Data Silos: If ticketing data, marketing data, and box office data are stored in separate systems, the full picture is obscured. Integration is crucial for accurate modeling.
- Lag Time Issues: Real-time data is ideal, but often there is a delay between a sale and its entry into the system. Decisions made on stale data can miss the window for optimization.
Successful distributors strike a balance. They use data to eliminate obvious errors and identify clear opportunities, but they leave room for creative judgment when the data is ambiguous or conflicting.
The Future of Screen Placement
As technology advances, the granularity of data will only increase. We are moving toward a future where booking decisions are made in near-real-time. Imagine a system that automatically adjusts screen counts daily based on morning box office numbers. If a film is trending up in Los Angeles, the system sends a request to the theater chain to add two more shows for that evening. This level of automation is already being tested in select markets.
Additionally, the rise of alternative content-live sports, concerts, and esports-is changing the landscape. Cinemas are no longer just for movies. Data now includes non-film revenue streams, allowing distributors to negotiate better deals by understanding the total value of a screen, not just its movie output. This holistic view benefits both the distributor and the exhibitor, leading to more stable and profitable partnerships.
For the independent filmmaker, this means a fairer playing field. You don't need a massive budget to compete; you need the right data to find your audience. By leveraging the same metrics used by major studios, smaller players can punch above their weight, securing screens in markets where they are most likely to succeed.
What is Per-Screen Average (PSA) and why does it matter?
Per-Screen Average (PSA) is the total box office revenue divided by the number of screens showing the film in a specific territory over a set period, usually a week. It matters because it normalizes performance, allowing distributors to compare success across different markets regardless of size. A high PSA indicates strong demand per screen, signaling that adding more screens could yield higher total revenue.
How does data-driven booking differ from traditional booking?
Traditional booking relies on relationships, brand recognition, and general market trends. Data-driven booking uses specific quantitative metrics like PSA, occupancy rates, and demographic alignment to make precise decisions about which screens to use in which locations. This reduces financial risk and optimizes revenue by matching films to their most receptive audiences.
Can small indie films benefit from data-driven strategies?
Yes, arguably even more than large blockbusters. Indies have limited budgets and cannot afford to waste resources on underperforming screens. By using data to identify niche markets with high affinity for their specific genre or theme, they can achieve higher PSAs and longer theatrical runs, maximizing their return on investment.
What are the risks of relying too much on data?
The main risks include overfitting to past trends, ignoring cultural shifts, and missing organic grassroots movements that aren't captured in pre-sales data. Data provides probabilities, not certainties. Successful distributors combine data insights with human intuition to account for unpredictable factors like viral social media moments or local community events.
How often should booking plans be adjusted?
In a data-driven environment, adjustments can happen weekly or even daily. After the opening weekend, distributors analyze the first few days' performance to decide whether to expand, contract, or hold steady. This agility allows them to react to real-world audience behavior rather than sticking to a rigid initial plan.